 Slovenčina
") Українська (Україна)
Українська (Україна)
 English
- Details
- Written by Super User
- Category: MIGRATION
- Hits: 47677
Migration is a process in which individuals and groups of people leave their homes for various reasons. The current mobility of people is higher than ever before in modern history1 and continues to increase sharply, becoming one of the determining global issues of 21st century. Almost all of the approximately 200 world states are countries of origin, transit or destination for the migrants.
FACTS & FIGURES ON WORLD MIGRATION
281 million: The estimated number of international migrants in the world2
- The overall number of international migrants has increased in the last few years from the estimated 173 million in 2000 to 221 million in 2010 and to 281 million in the present.3
- The number of persons migrated to foreign countries surged by 107 million (62 %) in the last 20 years (2000-2020).
4.: The migrants would constitute the fourth most populous country in the world
- If international migrants lived in one state, they would constitute the fourth most populous country in the world, after China, India and the United States, roughly equal to the size of the entire population of Indonesia.
3.6%: The percentage of migrants in the global population4
- In other words, one out of 28 persons in the world is currently a migrant who lives abroad; in 2000, one out of every 35 persons was considered a migrant.
- The percentage of migrants in the global population increased from 2.8% in 2000 to 3.6% in the present.
- In more developed regions (Europe and Northern America, plus Australia, New Zealand and Japan), almost 12 of every 100 inhabitants are international migrants, compared to only 2 in 100 in less developed regions (Africa, Asia excluding Japan, Latin America and the Caribbean, and Oceania excluding Australia and New Zealand.)
- The percentage of migrants in each country varies considerably. The countries with the highest percentage are the United Arab Emirates (88.1%), Qatar (78.5%), Kuwait (72.8%), Liechtenstein (67.9%) and Monaco (67.8%).
- Countries with the lowest percentage of migrants are represented by Morocco and Papua New Guinea (0.3% each), the Philippines, the Democratic People's Republic of Korea, Haiti and Sri Lanka (0.2% each), China, Indonesia, Myanmar, Madagascar, Viet Nam (0.1% each) and Cuba (0%); from the European Union Romania (3.7), Slovakia (3.6%), Bulgaria (2.7%) and Poland (2.2%).5
1/7: Every seventh person in the world is a migrant
- The estimated number of internal migrants (migrants inside of their country of origin) is 763 million.6 Together with the international migrants there is more than a billion of migrants in the world – every seventh person in the world is a migrant.
20: About two-thirds of the international migrants live in twenty countries of the world7
- In 2020, two-thirds of all international migrants were living in high-income countries.
- The majority of all international migrants live in the United States of America (50.6 million, or 18.1% of the world’s total), followed by Germany (15.8 m), Saudi Arabia with 13.5 million of migrants, the Russian Federation (11.6 m), the United Kingdom (9.4 m), the United Arab Emirates (8.7 m), France (8.5 m), Canada (8.1 m), Australia (7.7 m), and Italy with 6.4 million of migrants.8
86.7 million: Europe is the most attractive destination for migrants
- In 2020, almost one third (30.9%) of the total number of international migrants lived here.9
- Europe is followed by North America (58.7 million, of which 50.6 million resides in the United States of America) and Northern Africa and Western Asia (49.8 million).
- Between 2000 and 2020, the fastest increase in the number of international migrants was observed in Europe and Northern Africa and Western Asia.10
35.1 million: The number of migrants in the countries of the EU in 201811
- Migrants made up 7.9% of persons living in the EU Member States.
- From the overall number of migrants, 13.3 million migrants were residents of another EU country and the remaining 21.8 million were people with citizenship of a non-member country (representing 4.9% of the 446.8 million people living in the EU).
- Almost three-quarters (71%) of non-nationals living in the EU Member States were found in 4 EU Member States: Germany (10.1 million), Italy (5.3 m), France (4.9 m) and Spain (4.8 m).
48.1%: Percentage of women in the world migration12
- In total, 134.9 million female migrants were in the world in 2020.
- Women accounted for more than one half of the international migrants in 114 countries of the world.
- In 2020, the number of female migrants slightly exceeded that of male migrants in Europe, Northern America and Oceania due in part to the higher life expectancy of women among long-term migrants and to the increasing demand for female migrants for care-related work.
- Among the countries with the highest representation of women was Nepal, Hong Kong, SAR of China, Montenegro, Kyrgyzstan and Latvia.
39.1: The median age of all international migrants – compared with 30.9 years in the general world population13
- One out of every seven international migrants (14.6%) or 41 million of the global migrant stock) was under the age of 20.
- Three-quarters of the total population of migrants (73.2% or 205 million) were of working age between 20 and 64 years, compared to 57 percent for the total population.
- The world hosted 12.2 percent (34 million) of international migrants of the global migrant stock aged 65 or over.14
773 billion $: Estimated volume of remittances (financial resources) sent to home countries by migrants in 202115
- The remittances have increased from 132 billion USD in 2000 to 470 billion USD in 2010 and 719 billion USD in 2020.
- In 2020, the recipient countries with the highest volume of documented remittances were India (83.1 billion), China (59.5 b), Mexiko (42.9 b), the Philippines (34.9 b) and Egypt (29.6 b).16
- It is estimated that the real volume of remittances, including undocumented formal and informal remittance flows is significantly higher.
- Until 2022, the estimated volume of remittances is expected to increase to 802 billion USD.
605 billion $: The estimated volume of remittances, which were sent by migrants to low- and middle-income countries in 202117
- Until 2022, the estimated volume of remittances to these countries is expected to increase to 630 billion USD.
- Remittance flows to these countries (excluding China) in 2021 were larger than foreign direct investment flows and overseas development assistance.
50.4 million: The number of internally displaced persons in 201918
- This number of internally displaced persons that had been forced to flee their homes by armed conflict and generalised violence, and were living in displacement within the borders of their own country, increased from 21 million in 2000 to 45.7 million in 61 countries and territories at the end of 2019.
- Three-quarters (34.5 million) of the world’s internally displaced people as a result of conflict and violence live in just 10 countries: Syria (6.5 million), Colombia (5.6 m), Democratic Republic of Congo (5.5 m), Yemen (3.6 m), Afghanistan (3 m each), Somalia and Nigeria (2.2 m each), Sudan (2.1 m) and Iraq (1.6 m) and Ethiopia (1.4 m).
- In 2019, 33.4 million new displacements associated with conflict and disasters were recorded – that is 1 person forced to flee every 1 second.
- Of all new displacement in 2019, 8.5 million was triggered by conflict and violence (10.8 million in 2018), and 24.8 million was affected by natural disasters (17.2 million in 2018) – three times the number of displacements caused by conflict and violence.
- More than half of newly displaced people come from only four countries: India, the Philippines, Bangladesh and China.19
26 million: Estimated number of refugees in the world20
- Together with 50.4 million internally displaced persons, 4.2 million asylum seekers and 3.6 million Venezuelans displaced abroad there were 84.2 million refugees, asylum seekers and internally displaced persons in 2019.
- Two-thirds (68%) of all refugees worldwide come from just five countries: Syria (6.6 million), Venezuela (3.7 m), Afghanistan (2.7 m), South Sudan (2.2 m) and Myanmar (1.1 m).
- For several consecutive years Turkey hosted the largest number of refugees and with 3.9 million refugees (of which 3.6 million Syrian refugees) it became the largest refugee-hosting country worldwide. It was followed by Colombia (1.8 m), Germany (1.5 m), Pakistan and Uganda (1.4 m each).
- Three out of every four refugees lived in countries neighbouring their countries of origin.
- The island of Aruba hosted the largest number of Venezuelans displaced abroad in proportion to the national population (1 in 6) while Lebanon hosted the largest number of refugees (1 in 7 people) under the responsibility of UNHCR.21
- In 2019, 612.7 thousand first-time asylum seekers applied for international protection in the Member States of the EU with 676 thousand asylum seekers in total.
- The largest group of first-time applicants came from Syria (74,000 or 12.1%). Afghanis accounted for 8.6% of the total number of first-time asylum applicants and Venezuelans for 7.3 %, while Colombians and Iraqis for 5.2 % and 4.4 % respectively.
- One quarter of the refugees who apply for asylum in Europe submit their application in Germany (23% or 142,000 first-time applicants in 2019). It was followed by France (120 thousand), Spain (115 thousand), Greece (75 thousand) and Italy (35 thousand).22
1 Divinský, B., Migration Trends in the Slovak Republic after Its Accession to the EU (2004-2008), International Organization for Migration (IOM), 2009, p. 12 (https://iom.sk/sk/publikacie?download=106:migracne-trendy-v-slovenskej-republike-po-vstupe-krajiny-do-eu-2004-2008).
2 United Nations, Department of Economic and Social Affairs, Population Division (UN DESA, 2020) – International Migrant Stock 2020, Workbook: Age, sex and destination (https://www.un.org/development/desa/pd/sites/www.un.org.development.desa.pd/files/undesa_pd_2020_ims_stock_by_sex_and_destination.xls), UN DESA – International Migrant Stock 2020 Highlights. Ten Key Messages (https://www.un.org/development/desa/pd/sites/www.un.org.development.desa.pd/files/international_migration_2020_highlights_ten_key_messages.pdf), UN DESA – International Migrant Stock 2020 Highlights (https://www.un.org/development/desa/pd/sites/www.un.org.development.desa.pd/files/undesa_pd_2020_international_migration_highlights.pdf).
3 Look at [2].
4 Look at [2].
5 Look at [2].
6 UN DESA – Technical Paper No. 2013/1 – Cross-national comparisons of internal migration: An update on global patterns and trends (http://www.un.org/en/development/desa/population/publications/pdf/technical/TP2013-1.pdf).
7 Look at [2].
8 Look at [2].
9 Look at [2].
10 Look at [2].
11 Eurostat – Migration and migrant population statistics (as of 1 January 2019) (https://ec.europa.eu/eurostat/statistics-explained/index.php/Migration_and_migrant_population_statistics).
12 Look at [2].
13 Look at [2] and UN DESA – World Population Prospects 2019, Median Age of Population (https://population.un.org/wpp/Download/Files/1_Indicators%20(Standard)/EXCEL_FILES/1_Population/WPP2019_POP_F05_MEDIAN_AGE.xls).
14 Look at [2] and UN DESA – International Migrant Stock 2020, Workbook: Age and Sex (https://www.un.org/development/desa/pd/sites/www.un.org.development.desa.pd/files/undesa_pd_2020_ims_stock_by_age_sex_and_destination.xlsx)
15 The World Bank – Migration and Development Brief 36, May 2022 (https://www.knomad.org/sites/default/files/2022-05/Migration%20and%20Development%20Brief%2036_May%202022_0.pdf), Migration and Development Brief 2, November 2006 (http://pubdocs.worldbank.org/en/372901444756856754/MigrationDevelopmentBriefingNov2006.pdf).
16 The World Bank – Migration and Remittances, Annual Remittances Data as of May 2022 (https://www.worldbank.org/en/topic/migrationremittancesdiasporaissues/brief/migration-remittances-data).
17 Look at [15]
18 Internal Displacement Monitoring Centre (IDMC) (http://www.internal-displacement.org).
19 IDMC – Global Report on Internal Displacement 2020 (https://www.internal-displacement.org/global-report/grid2020/).
20 The United Nations High Commissioner for Refugees (UNHCR) – Global Trends. Forced displacement in 2019 (https://www.unhcr.org/globaltrends2019/). The number includes also 5.6 million Palestinian refugees registered by the United Nations Relief and Works Agency for Palestine Refugees in the Near East (UNRWA).
21 When Palestine refugees under UNRWA’s mandate are included, the figures rise as follows: 1 in 5 people was a refugee in Lebanon and 1 in 3 people was a refugee in Jordan.
22 Eurostat – Asylum Statistics (https://ec.europa.eu/eurostat/statistics-explained/index.php/Asylum_statistics).
Last updated on 18 May 2022.
- Details
- Written by Super User
- Category: MIGRATION
- Hits: 70129
Slovakia is not one of the traditional final destinations for migrants. It is a culturally homogeneous country, which was not affected by the dramatic increase in migration during the twentieth century. Until recently, Slovakia was almost exclusively the country of origin of the migrants, in other words, a country whose residents used to migrate abroad for various reasons.
It was the accession of the Slovak Republic (SR) to the European Union (EU) and the Schengen Area that caused more significant changes. During the period since 2004, illegal and asylum migration has decreased and legal migration has increased eight times. Although the increase in foreign population in Slovakia in the years 2004 – 2008 was the second highest among the EU states, the representation of foreigners in the population remains low. Today foreigners make up 5.13 per cent of the population and their number is slowly, yet continuously increasing: in December 2022, there were about 111 076 more foreigners living in Slovakia than the year before, which means an increase of 66.3 %.1 which has been caused mainly by the influx of people from Ukraine.
In addition to migration based on social reasons, such as family reunification or marriage to a Slovak citizen, the most significant component of legal migration to Slovakia is currently migration for business purposes, work and study.
(Unless otherwise stated, the following statistics were updated as of 31 December 2022.)
FACTS & FIGURES ON MIGRATION IN SLOVAKIA
278,595: The number of foreigners with residence permits in Slovakia in December 20222
- They represent 5.13 % of the total population of Slovakia.3
- Since the accession of SR into the EU in 2004, the number of legally living foreigners in Slovakia has increased almost twelve times (from 22,108 migrants in 2004 to 278,595 in December 2022).
- If all the foreigners in SR concentrated in one place, they would create a town with populations like Košice and Poprad together.
3.: Out of all the EU countries, Slovakia has the third lowest proportion of foreigners4
- Only Poland (1.21 %) and Romania (0.75 %) have a lower proportion of foreigners in the total population.
- Out of the neighbouring countries, the Czech Republic (5.96 %) and Austria (16.99 %) all have a higher proportion of migrants.
- Millions of people have been forced to leave their homes and Ukraine because of the war in Ukraine. The current situation of migration from Ukraine to neighbouring states and other European countries, as well as migration flows to Ukraine, is reported by UNHCR.5
67.5 %: The proportion of Austrian, Czech, Hungarian, Polish and Ukrainian citizens in the total population of foreigners in the SR6
- Traditionally, the most numerous category of foreigners in Slovakia is formed by the citizens of neighbouring countries, who are mostly linked to Slovakia by work, family and social relations.
- Another important group of foreigners is formed by the citizens of the southeastern European countries (Romania, Bulgaria, Russia, Serbia), who represent 12.3 % of all foreigners in Slovakia.
- In the past, the nationals of these countries formed their communities in Slovakia and their compatriots continue to come to Slovakia because of studies, work or family reasons.
- Foreigners from Asian countries (Vietnam, China, Korean Republic, Thailand), who were dynamically growing group of foreigners in Slovakia in the past and now the increase in their number has slowed, form together 4.6 % of all foreigners in Slovakia; their number amounted to 12,866.
20 %: The citizens of the EU countries account for one-fifth of all foreigners in Slovakia
- Most EU countries citizens in Slovakia come from the Czech Republic (12,755). They form 4.6 % of the total population of foreigners.7
- Apart from the nationals of Hungary (3.5 %) Romania (2.5 %), and Poland (2.2 %), the citizens of Germany (1.6 %) and Italy (1.1 %) are also numerous among the EU countries citizens living in Slovakia.
1/2: The proportion of Ukrainians in the total number of foreigners in Slovakia (56.3 %); Ukrainians are the most numerous group of foreigners in Slovakia both from the EU and outside the EU8
- Considering non-EU nationals in Slovakia, Ukrainians (156,881) are followed by the nationals of Serbia (18,215), Vietnam (8,039), the Russian Federation (7,436) and North Macedonia (2,842).
- There has been a significant increase in the group of citizens from Ukraine who came to Slovakia as a result of the war in their native country.
79.9 %: The proportion of non-EU nationals in the overall number of foreigners in Slovakia
- This proportion represents approximately 4.1 % of the population of the SR.
- If all non-EU nationals in Slovakia concentrated in one place, with a number of 222,525 people they would form a town almost as large as Košice.
87,998: The number of foreign employees in the SR in December 20229
- Currently, there is one foreign employee per 28 national employees.10
- Since Slovakia’s accession to the European Union, the number of foreign employees has increased more than twenty-six times – from 3,351 persons in 2004 to 87,998 in December 2022, including 56,876 non-EU nationals.
- In 2022, foreigners from ca 140 countries were employed in Slovakia, most of them from Ukraine (33,419), Serbia (9,798), Romania (7,025), Czech Republic (6,514) and Hungary (5,574).11
- Among the foreign workers, men constitute a substantial majority; they form 62 % of all employed foreigners.12
11 791: The number of foreigners who in 2022 illegally crossed the borders or illegally resided in the territory of the Slovak Republic13
- Since the accession of the SR into the EU in 2014, the illegal migration to SR has decreased eight times: from 10,946 illegal migrants in 2004 to 1,304 in 2014.
- In 2020, the number of foreigners who illegally crossed the border or illegally stayed on the territory of the Slovak Republic was 1,295, in 2021 it increased to 1,769 and in 2022 it increased to 11,791.14 One of the reasons for the increase was the increased flow of transit migration from the Western Balkans.
547: The number of applications for asylum in the SR in 202215
- In 2021, citizens of Ukraine, Turkey, Morocco, Bangladesh, and the Russian Federation applied for asylum in the Slovak Republic most often.
- From January to December 2022, the Slovak Republic granted asylum to 23 people.
- By comparison, in 2004 11,395 persons applied for asylum in the SR; in the last years, the number of applications has stabilized at several hundred per year.16
- From the overall number of 60,242 applications since 1993, the asylum was granted to 926 people, whereas 853 people were provided subsidiary protection as another form of international protection.17
1 Bureau of Border and Alien Police of the Presidium of the Police Force (BBAP P PF) – Statistical Overview of Legal and Illegal Migration in the Slovak Republic in 2021 and 2022 (http://www.minv.sk/?rocenky)
2 BBAP P PF – Overview of Legal and Illegal Migration in the Slovak Republic 2022 (https://www.minv.sk/swift_data/source/policia/hranicna_a_cudzinecka_policia/rocenky/rok_2021/2021-rocenka-UHCP-SK.pdf)
3 Statistical Office of the Slovak Republic – Stock of the population in the SR on 31st December 2022 (5,428,792) (https://slovak.statistics.sk/LinkComposer/lc?l=SK_INF&c=05493527-5302-4b03-b766-a30e20902800)
4 Eurostat – Population by citizenship and residence – Foreigners (Statistics as of 1 January 2021) (https://ec.europa.eu/eurostat/databrowser/view/tps00001/default/table?lang=en, https://ec.europa.eu/eurostat/databrowser/view/tps00157/default/table?lang=en and https://ec.europa.eu/eurostat/databrowser/view/tps00178/default/table?lang=en)
5 UNHCR - Operational Data Portal: Ukraine Refugee Situation (https://data.unhcr.org/en/situations/ukraine)
6 Look at [2]
7 Look at [2]
8 Look at [2]
9 Central Office of Labour, Social Affairs and Family - Employment of foreigners in the Slovak Republic for the year 2022, December 2022 (https://www.upsvr.gov.sk/buxus/docs/statistic/cudzinci/2022/cudzinci_2212.xlsx)
10 Statistical Office of the SR – Employment in 2022 (2,488,000, after deducting people working abroad) (https://www.susr.sk/LinkComposer/lc?l=SK_INF&c=1110dcef-9bde-4c43-bce9-1ea2cd55a7c2).
11 Look at [9]
12 Look at [9]
13 Look at [2]
14 BBAP P PF – Statistical Overview of Legal and Illegal Migration in the Slovak Republic (from 2000 – 2021) (http://www.minv.sk/?rocenky)
15 Migration Office of the Ministry of Interior of the SR – Statistical overview of asylum seekers as of December 2021 (https://www.minv.sk/?statistiky-20&subor=433405) and Statistical report for 2022 (https://www.minv.sk/?statistiky-20&subor=468036)
16 Statistics of the Migration Office of the Ministry of Interior of the SR (http://www.minv.sk/?statistiky-20)
17 Look at [15]
Last updated on 27 March 2023.
- Details
- Written by Super User
- Category: MIGRATION
- Hits: 23321
International Organization for Migration (IOM) published a set of educational materials on migration: a documentary film, a didactic material, an information poster and a series of podcasts Aj my sme tu doma (We are Also at Home Here), along with tips for accompanying activities for the podcasts.
The educational materials serve as a wide-range presentation tool to the introduction of migration and migrants to the public. It should help especially teachers and lecturers when introducing migration into multicultural education at all levels of formal education and into trainings in intercultural skills of professionals working with migrants.
Didactic material
The didactic material "We are at home here" is designed to be used by teachers and lecturers. It provides them with flexible, user-friendly material with evidence-based information, activities and references to other resources, which can be easily used in an interesting way to introduce the topic of migration and integration into education.
The material introduces definitions of basic terminology on migration and integration of migrants in the world and in Slovakia, and it presents the results of representative public opinion research on migration and migrants. The material also provides instructions on how to work with the film "We are at home here" and it includes interactive activities to be used before and after the film screening which should engage the audience in the topic, raise awareness of migration issues and help to form opinion on migration.
Documentary film
The documentary "We are at home here" reflects the attitudes of the Slovak public towards migrants and through personal stories of a Palestinian doctor, florist from Ukraine and Vietnamese entrepreneur it introduces the life of migrants in Slovakia. Apart from the reality the film also presents interesting facts on migration and migrants living here. The documentary film can be projected directly from this site:
The film is also available in HD quality at the IOM YouTube site.
The Poster
This poster "We are at home here" promotes the topic of migration and migrant integration. It can be printed and displayed on its own or it can be complemented with further information and photos related to migration and integration.
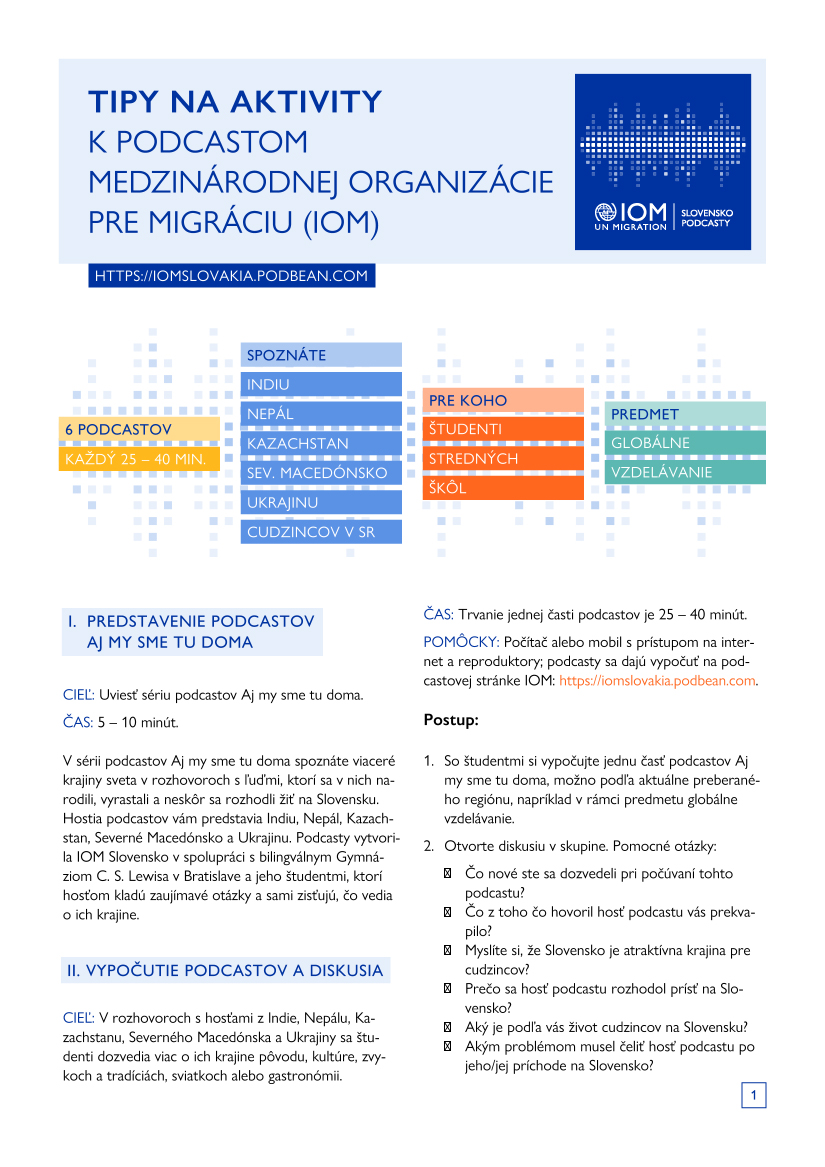
Podcasts
![]()
Tips for activities with the podcasts
All these educational materials can be used freely and disseminated for non-commercial use for the purpose of intercultural education, trainings in intercultural skills and for public presentation as a means of contributing to forming of an informed public opinion on migration and migrants, stimulating discussion on migration and migrants and, thus, contributing to removing stereotypes and myths in society and preventing of bias, intolerance, discrimination and xenophobia. No educational materials or any part of them may be reproduced, stored in a search engine, disseminated or transmitted in any form, or by any means, without the prior written permission of IOM.